


There's a moment in every cultural institution's digital journey where a static page just isn't enough. A list of heritage sites. A database of displaced families. A directory of historic buildings. The information exists — years, sometimes decades of it — but it's trapped in spreadsheets, filing cabinets, and PDF reports that only researchers know how to navigate. Interactive maps are changing that. And for the organizations we work with, they've become one of the most powerful tools for making history accessible, personal, and alive.
The shift from archive to experience
Cultural institutions have always been in the business of preservation. But preservation alone isn't enough in a world where people expect to find, explore, and connect with information on their own terms. A descendant in Manitoba shouldn't need to write a letter to a museum in BC to find out where their grandparents once farmed. A resident in Vancouver shouldn't need a guided tour to understand the heritage of the street they walk every day. Interactive maps close that gap, they transform static archives into living, searchable, explorable experiences that meet people exactly where they are.
The technology has matured significantly. What once required custom GIS software and specialist knowledge can now be built on flexible CMS platforms like Statamic, integrated with mapping APIs, and delivered as fast, mobile-responsive web applications. The barrier is no longer technical, it's knowing how to structure the data, design the experience, and build for the audiences who need it most.
What we’ve learned building interactive maps for cultural institutions
We've had the privilege of building interactive map applications for two remarkable organizations — the Vancouver Heritage Foundation and the Maple Ridge Museum & Community Archives. Both projects taught us something fundamental: the map is never just a map. It's a user experience problem, a data architecture problem, and a design problem all at once.
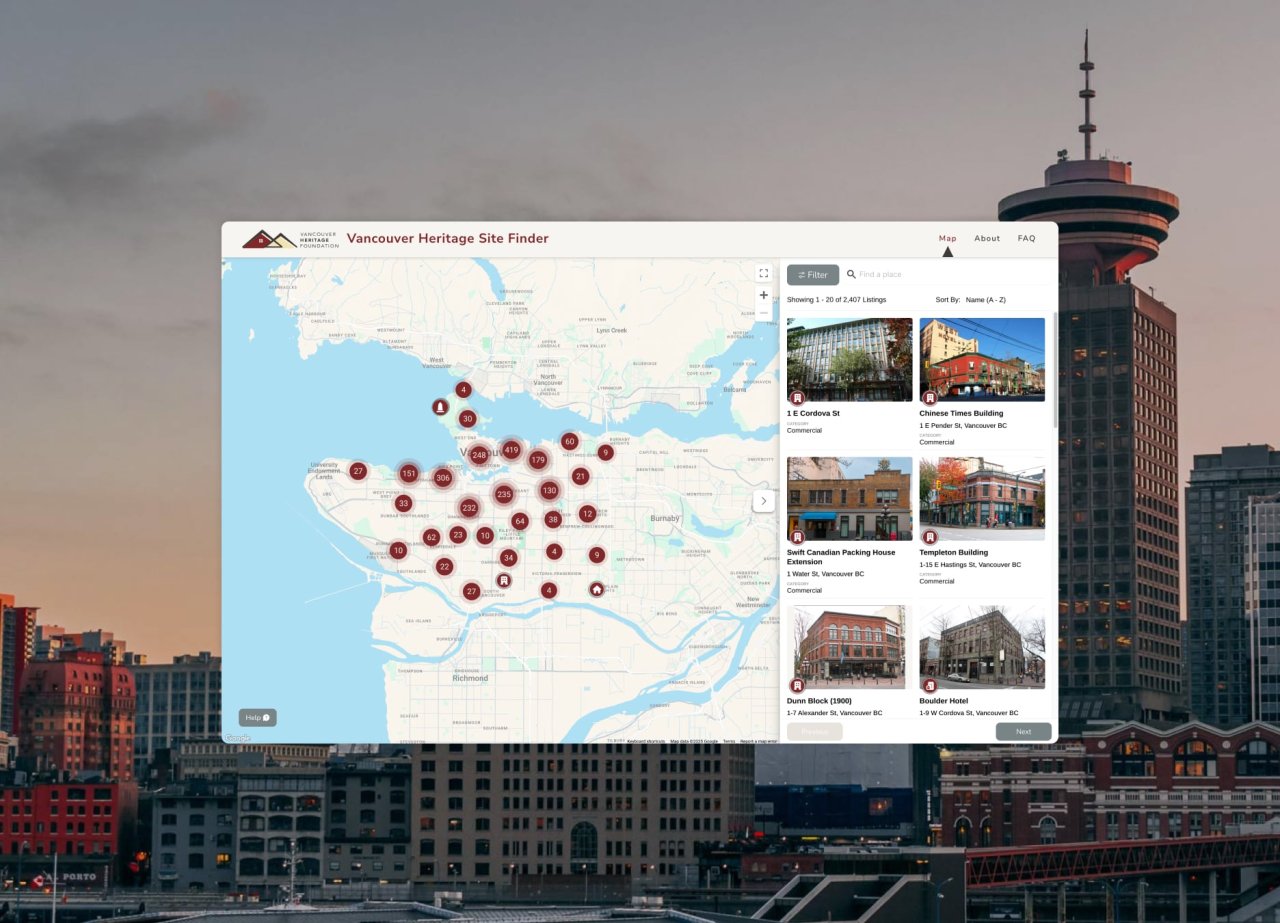
For the Vancouver Heritage Foundation's Heritage Site Finder, the challenge was scale and discoverability. With over 2,200 historical sites across the city, the map needed to be intuitive enough for a curious tourist and detailed enough for a heritage researcher. Every icon opens a rich profile — photos, historical context, multimedia content — and users can submit their own stories, turning the platform into a living community archive.
For Traces of Home, the Maple Ridge Museum's project documenting the Japanese Canadian community displaced during WWII internment, the challenge was emotional as much as technical. We were building something that descendants — people searching for their grandparents' farms — would use to find a connection to a place they'd never seen. Every design decision carried weight. The filters we built go beyond a simple name search: users can explore by neighbourhood, land ownership status, exile history, families who returned, residence after dispersal, and occupation. Each filter reflects a dimension of a community's story that deserves to be told.
The anatomy of an interactive map
From our experience, successful interactive map applications share a few critical ingredients. First, data architecture: before a single line of code is written, the underlying data needs to be structured for the web. This is often the most underestimated part of the process — and the one that determines everything downstream. Second, user research: who are the audiences, what are they looking for, and how do they think about the information? For heritage and cultural projects, you're often serving two very different users — the casual explorer and the dedicated researcher — and the experience needs to work for both. Third, visual design that honours the subject matter: interactive maps for cultural institutions aren't SaaS products. The visual language, typography, and interaction design should feel intentional and connected to the history being told. Finally, accessibility: these platforms exist to include people, not exclude them. AODA and WCAG compliance is foundational.
The opportunity ahead
We're at an inflection point for cultural institutions online. Audiences expect more than a brochure website. They want to explore, contribute, and connect. Interactive maps done well are one of the most compelling ways to deliver that. If your organization is sitting on years of research, archival data, or geographic information that deserves a wider audience, we'd love to talk about what's possible. Get in touch.