August 4, 2015
The goal of Google Analytics is to collect user activity via interactions. That means Google measures each visitors activity, and compiles it into a hit or interaction, which is in turn sent to your Google Analytics data base. This is how basic data is collected from your website.
Google Analytics can be a fairly complicated tool to use. Understanding how to view your data properly can save you time and help you learn more about your website. There is a lot of data available to you inside the Analytics reports and it can be hard to sort through and find useful information that you can use.
We’re going to look at a couple areas that you can find useful data easily within your Google Analytics Reports. First up, the default reporting graph.
Default Graph
You see it every time you login to analytics, but probably just take a quick scan of the data and have a look at the graph right? There is a vast quantity of information available to you right here with just a couple clicks. Let’s go through them.
Start by setting your desired date range in the top right corner of the report. Most reports will default to the last month of data, but you can pinpoint individual days if you want to check what happened on your website for specific days. For this example we will keep the default 1 month data window.
Next up click the secondary dimension button underneath the graph just above your Default Channel Grouping label.
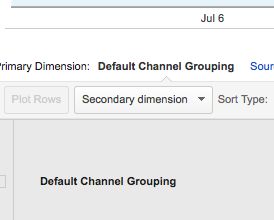
Under this tab you can select a ton of different metrics to display against your traffic. Your choices are:
- Acquisition
- Advertising
- Behaviour
- Custom Variables
- Ecommerce
- Social
- Time
- Users
Each of these categories has their own sub categories as well for further drill down. Let’s have a look at the subcategories found under users. There are a lot of options here, and all of these choices will provide you with data relative to your overall traffic from your data window. You can find things such as:
- Affinity Category (reach): These are the same interest or “Affinity” categories that Google Adwords uses to target users with specific interests such as Auto, Movies, Sports, Food, Fashionistas, etc. These are higher in the sales funnel more on a entry level interest.
- In-Market Segment: Provides similar data to Affinity Category but for people lower in the sales funnel, who are closer to making a purchase.
- Browser: Which browsers people are using to access your website.
- Screen Resolution: See what the most common screen sizes are that people view your website with. You can use this data to make sure your website looks great at the size it’s being used most often.
- Mobile Device: Tells you what phone models people are using to access your content. This gives you insight that you should use for future mobile designs ideas and testing purposes. Also if you were considering an app you can use this information to your advantage as well.
Intelligence Events
These are automated alerts that Google send out to you when an anomaly is detected. Here’s a video summary to clarify things further.
Real Time
Real Time let’s you see what is taking place at any time live on your website. One of the key features you can see is content. By hitting your content tab you will see exactly what your current users are looking at. Having a live look at what people are interested in at that time could give you insight into a popular topic or product that you can focus on marketing through social media to quickly engage other people that might have similar interests.
Audience
One of my favourite tabs under Audience is User Flow. This is a map of users entrances and exits across the website. You can see their country of origin, their first piece of content, second, and so forth all the way until the exit the website.
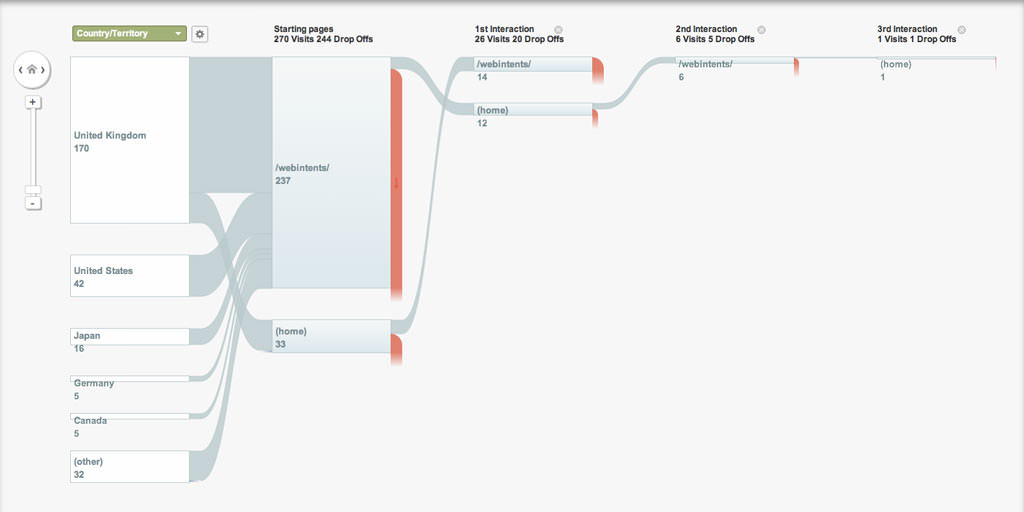
This is a basic version of your websites sales funnel. You can see how people moved across your site and where they fell off as well. Using this data can help perfect your sales flow in the future, fixing problems areas you may have not known about.
Acquisition
Probably one of the main tools used inside of Google Analytics because it has the power to tell you what people are searching for. There are many useful data sets under the Acquisition tab, but I want to focus on Sub category of Search Engine Optimization > Queries and Landing Pages.
- Queries will show you what the most common search terms you are showing up for are as well as how many people are actually choosing to click your link for that phrase.
- Landing pages shows you what your most popular pages are and this can be sorted by date of course allowing you to pinpoint trends and other useful data.
Behaviour
One of the more complex features that Google Analytics has is called In-Page Analytics and it allows you to actually view where people clicked on your website on a basic level. Very useful information if you want to see how a particular call to action is working or where people find it easiest to navigate around your website.
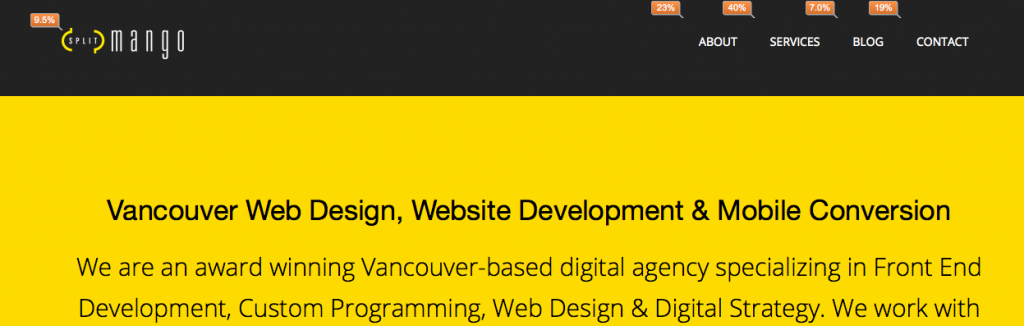
Small bubbles will appear on your website when you load the In-Page Analytics in full view. These will tell you what percentage of people clicks on certain links. This can be very telling information as to the usability of your website.
Conversion
Lastly we have the Conversion tab and its subset of data. Goals are the premise of your business online and being able to track and monitor them accurately is very important. Some websites have very small goals set up that simply strive to see a button clicked on their homepage while others are looking for forms to be filled out and submitted. Whatever the goals of your website are this is the area you can track them. Keep in mind they must be setup before hand though as there are no default goals in Google Analytics. We will be covering this aspect later.
In Summary
We’ve covered some of the many tools and data sets that are available within the Google Analytics, but there are of course many more. You can use some of the tools listed here to really dig into your website’s data and better understand how users are interacting and what they are interacting with. The goal, in the long run, is to make better educated decisions about the future of your website and the future of your business.
Next week we will be covering some tips on how to set up custom goal tracking, so keep an eye out for that. For more information on Google Analtyics check out Analytics Academy!
Thanks for reading.